 SIGOISETTE / ISTOCK / GETTY IMAGES PLUS
Update on Alternative Payment Models in Oral Healthcare
This new analysis paints a fresh perspective on traditional versus emerging reimbursement models for dental services.
PURCHASE COURSE
This course was published in the November 2022 issue and expires November 2025. The authors have no commercial conflicts of interest to disclose. This 2 credit hour self-study activity is electronically mediated.
This course was published in the November 2022 issue and expires November 2025. The authors have no commercial conflicts of interest to disclose. This 2 credit hour self-study activity is electronically mediated.
AGD Subject Code: 550
EDUCATIONAL OBJECTIVES
After reading this course, the participant should be able to:
- Explain key differences between traditional fee-for-service (FFS) reimbursement in dentistry and alternative payment models (APMs) designed to reduce healthcare costs and improve outcomes.
- Describe factors that influence U.S. healthcare costs, as well as key findings in the authors’ expenditures and utilization analysis of FFS models compared to APMs.
- List a chief public/private partnership that is working to establish core principles that will guide the creation of cost effective and outcome driven APMs.
The past decade has seen a shift in healthcare payment models that de-emphasizes the volume of activity performed by providers, known as fee for service (FFS), and emphasizes payment for the quality of care provided, known as value-based payment. This transformation is driven by discrepancies in the rising cost of U.S. healthcare spending compared with associated health outcomes.1 The increasing prevalence of chronic disease, lack of access to preventive care, inadequate insurance coverage, and other non-medical drivers of health influence this rising cost of care.2–4 Value-based payment aims to incentivize value-based, quality care to effectively manage costs while ensuring access to insurance coverage, preventive care, and patient-driven disease management. This pursuit has been enabled by policy and regulatory activity, as well as establishment of public/private partnerships — such as the Health Care Payment Learning and Action Network (HCP-LAN) — to drive action and track progress.5,6 The HCP-LAN guides organization and learning in the area of value-based payment, establishing core principles for the design of alternative payment models (APMs).
Even with increasing evidence of the link between oral and systemic health,7 dentistry has often been left out of the exploration and testing of APMs in medicine and has been slow to adopt APMs on its own. In fact, a survey completed by the DentaQuest Partnership for Oral Health Advancement (now the CareQuest Institute for Oral Health) found that 51% of responding providers had never heard of APMs in dentistry, while 35% had only heard of APMs or knew a little about them.8 Dentistry has seen some piloting of APMs through state Medicaid programs contracting with dental plans. A recent analysis sought to use this Medicaid data to evaluate spending and utilization, comparing FFS payments to APMs in Medicaid across the lifespan from 2013 to 2017.9 This analysis showed an increase in the number of Medicaid APM claims, with lower spending over the lifetime than FFS plans, followed by improved utilization of dental services compared to the traditional FFS model.
The transition to value-based payment will be a gradual process, accompanied by the need for constant evaluation to monitor status, outcomes and perceptions of the models.10 Because of this, the authors sought to update the 2013–2017 analysis to compare spending and service utilization of dental FFS to dental APMs through 2019.
METHODOLOGY
The analysis presented here examines spending on dental care over the lifespan (ages 0 to 89) in FFS and APMs in a national Medicaid dataset for the years 2013, 2016 and 2019. The analysis utilizes a nationally representative sample containing all Medicaid claims from 13 de-identified states obtained from the IBM Watson Medicaid MarketScan Database (https://www.ibm.com/products/marketscan-research-databases) totaling 17.8 million enrollees and 60 million dental claims made by more than 7.7 million patients. The authors also include comparisons of costs for fully capitated, global risk dental plans managed by Advantage Dental+ in Oregon (the Western Institutional Review Board granted an exemption for the purposes of this study).
In the IBM Watson data, costs are calculated using a net payment variable that reflects the actual amounts reimbursed to providers. Costs for capitated plans in both the IBM Watson and global risk plan are calculated using the accepted usual, customary and reasonable (or UCR) fee schedule. All costs are inflation-adjusted to 2019 dollars. Mean spending is calculated by dividing the total spent in that category by the number of patients with a dental claim at each year of age. Dental utilization is calculated by dividing the total number of patients with a dental claim by the number of enrollees at each year of age. Dental claims are identified by the American Dental Association’s Code on Dental Procedures and Nomenclature (or CDT) codes.
COST CONTROL
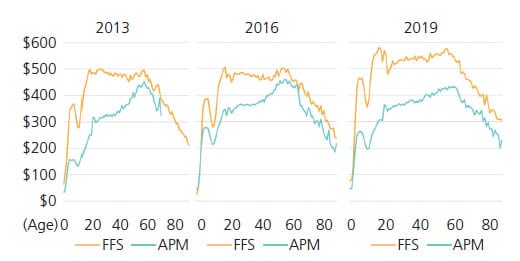
The analysis found the average cost of care per patient changed over time, with differences based on patient age and plan type (Figure 1). The cost per patient in dental FFS remained consistently high through the lifespan, reaching close to $600 in 2019, until the later stages of life, about 70 years of age and older. Compared to 2013 and 2016, the cost of care per patient under FFS in 2019 increased by an average of 14% in the early (under 18 years) and middle age (19 to 64 years) stages of the lifespan. In contrast, dental APMs had a lower cost per patient over the lifespan compared to dental FFS in 2013, 2016 and 2019, except for those 0 to 2 years of age. Interestingly, in 2019, there was a larger gap in cost of care per patient between dental FFS and APMs compared to 2013 and 2016. This may be because more states have expanded their FFS Medicaid adult dental benefit,11 increasing access to care and the volume of patients seen under an FFS arrangement.
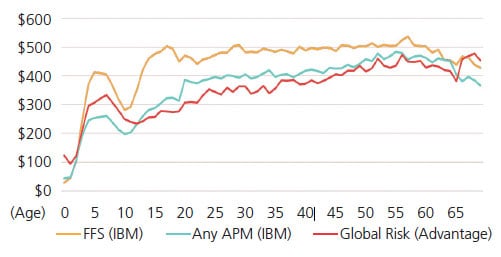
When comparing dental FFS to global risk payment models, the cost per patient followed the same trend as APMs overall in 2018 (Figure 2). Average cost per patient in any APM was $366, while the global risk APM design averaged $353. Both were generally less than FFS ($446) across the lifespan.
UTILIZATION OF SERVICES AND FOCUS ON PREVENTION
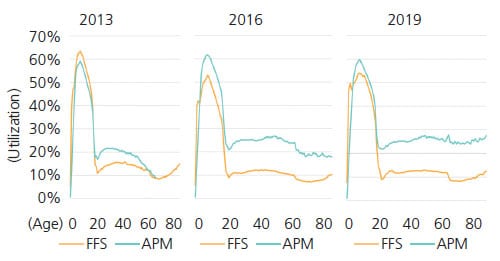
Dental service utilization was also measured over the lifespan and stratified by plan type (Figure 3). In all years and plan types, dental utilization was highest in the 0 to 21-year age group, likely due to the focus on pediatric patients within Medicaid reimbursement and resulting access to care. Generally, utilization under APMs was higher than dental FFS across the lifespan. This gap in utilization between APMs and FFS was smallest in 2013, with wider gaps noted in 2016 and 2019.
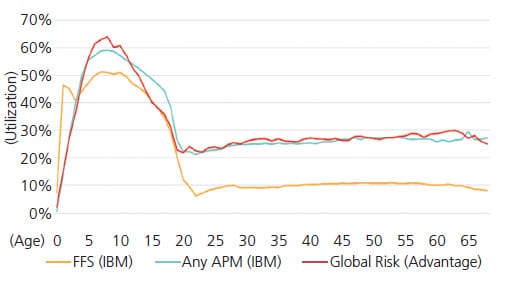
When comparing dental service utilization under a global risk APM structure to dental FFS in 2018, the same trend was observed. In fact, utilization in any APM and the global structure was higher by at least 10% compared to dental FFS (Figure 4). While some APM types outlined by the HCP-LAN do not include provider risk-sharing with a payer (e.g., performance-based incentives), other types, such as a global structure, allow providers take on financial risk of patient care costs. This risk-sharing arrangement allows for better provision of appropriate services, especially those that help address social risk factors (e.g., economic stability, housing or food access), ultimately driving more equitable access to care. The global risk model allows providers to better manage the cost of care and help accomplish the triple aim of healthcare.12,13
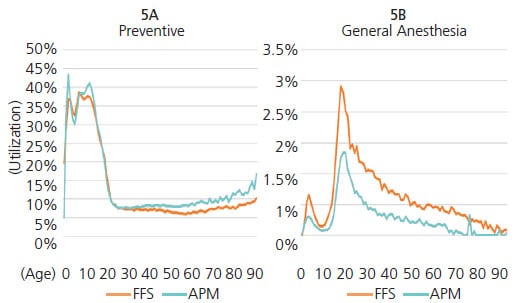
Appropriate provision of services by healthcare professionals and utilization by patients are both key to cost containment and improving health outcomes. For example, provision of primary and secondary preventive dental interventions has been shown to help prevent caries and manage disease progression.14 However, reimbursement schemes must be designed to incentivize providers to deliver these services. This analysis found that patients in APMs are more likely to receive all types of services, particularly preventive care. Across the lifespan, children and older adults are more likely to receive preventive services than those in an FFS arrangement (Figure 5A), including silver diamine fluoride and sealants. Utilization of general anesthesia is also lower under APM than FFS arrangements across the lifespan (Figure 5B). Moreover, compared to patients seen under an FFS plan, patients enrolled in APMs are less likely to visit the emergency department for a dental condition, receive an opioid prescription for oral health reasons, and utilize a hospital operating room for dental surgery.
LIMITATIONS
Because the study is based on claims data, the findings reflect only those who accessed healthcare for a dental procedure or presented with a dental diagnosis. As the data is constructed to provide markers for two payment types (FFS and APM), it was not possible to evaluate the type of APM design or financial structure. However, this was accomplished to some degree by evaluating a global payment structure and encounter data from national federally qualified health centers — although these separate data sources cannot be mapped to the Medicaid claims data.
Individual state data cannot be extracted from the dataset. Because the Medicaid claims data used in these analyses came from three distinct years from 13 de-identified states, confounding factors — such as state-level health policy changes and specific Medicaid enhancement or restrictions instituted during this time — could not be analyzed.
Worth noting is that after much consideration, the authors decided not to include data from 2020 in this analysis. While there was much data for this calendar year, it was hard to interpret and draw conclusions due to the effects of the COVID-19 pandemic on dental care access and delivery. It also had the potential to confound the themes of this report. Data from 2020 is currently being analyzed for a future report to more fully direct attention to the pandemic’s effects on care delivery and payment models in dentistry.
Lastly, total cost of care is a key factor in understanding the success of APMs; however, total dollar figures could not be included due to guidance from IBM Watson and fluctuations in the way managed care companies calculate payment variables.
CONCLUSION
This updated 2019 analysis of dental FFS versus APMs followed trends of the 2013–2017 analysis. It shows that APMs promoted higher utilization and lower cost when compared to dental FFS through 2019. Value-based purchasing encourages value-based care pathways and improved dental service utilization, particularly preventive services. As awareness of, and experience with, value-based care and value-based purchasing grows in both medicine and dentistry, these trends are expected to gain momentum. It is vital that dentistry continues to adapt to shifts in payment transformation to create a more equitable, accessible and integrated health system for everyone.
Acknowledgment: The authors thank Lisa J Heaton, PhD, a science writer at CareQuest Institute for Oral Health, for reviewing this report.
REFERENCES
- Peter G Peterson Foundation. How Does the U.S. Healthcare System Compare to Other Countries? Available at: https://www.pgpf.org/blog/떔/葓/how-does-the-us-healthcare-system-compare-to-other-countries. Accessed September 29, 2022.
- U.S. Centers for Disease Control and Prevention. Chronic Diseases in America. Available at: https://www.cdc.gov/chronicdisease/resources/infographic/chronic-diseases.htm. Accessed September 29, 2022.
- Borsky A, Zhan C, Miller T, et al. Few Americans receive all high-priority, appropriate clinical preventive services. Health Aff. 2018;37:925–928.
- Call KT, McAlpine DD, Garcia CM, et al. Barriers to care in an ethnically diverse publicly insured population: is health care reform enough? Med Care. 2014;52:720–727.
- U.S. Centers for Medicare and Medicaid Services. What are the value-based programs? Available at: https://www.cms.gov/Medicare/Quality-Initiatives-Patient-Assessment-Instruments/Value-Based-Programs/Value-Based-Programs. Accessed September 29, 2022.
- Health Care Payment Learning and Action Network. Alternative payment model (APM) Framework. Available at: https://hcp-lan.org/apm-framework/. Accessed September 29, 2022.
- American Dental Association. Oral-Systemic Health. Available at: https://www.ada.org/resources/research/science-and-research-institute/oral-health-topics/oral-systemic-health. Accessed September 29, 2022.
- Apostolon D, McLeod C, Tranby E, Mathews R. Alternative Payment Models in Dentistry. Available at: https://www.carequest.org/resource-library/alternative-payment-models-dentistry. Accessed September 29, 2022.
- Boynes S, Brown C, Tranby EP. Exploring alternative payment models for oral health care. Decisions in Dentistry. 2020;6(1):30–32,35.
- Barefoot S. Playing the Long Game With Value-Based Care. Available at: https://www.dentistrytoday.com/playing-the-long-game-with-value-based-care/. Accessed September 29, 2022.
- DentaQuest. Protecting the Progress Made Expanding Medicaid Adult Dental Benefits. Available at: https://whatsnew.dentaquest.com/protecting-the-progress-made-expanding-medicaid-adult-dental-benefits/. Accessed September 29, 2022.
- Saunders RS, Muhlestein D, McClellan MB. Medicare Accountable Care Organization Results for 2016: Seeing Improvement, Transformation Takes Time. Available at: https://www.healthaffairs.org/do/葖.1377/forefront.20171120.211043/full/. Accessed September 29, 2022.
- Institute for Healthcare Improvement. IHI Triple Aim Initiative. Available at: http://www.ihi.org/Engage/Initiatives/TripleAim/Pages/default.aspx. Accessed September 29, 2022.
- Ludwig S, Tranby EP, Mitchell M, Fullman J, Allen G. System level interventions to reduce utilization of general anesthesia to treat dental caries: a practice brief. J Public Health Dent. 2020;80(Suppl 2):S122–S125.
From Decisions in Dentistry. November 2022;8(11)26-29.