
Special Report—Dental Economic Realities
Demographic shifts and projections for rising health care expenditures are reshaping traditional dental fiscal models.
Demographic shifts and projections for rising health care expenditures are reshaping traditional dental fiscal models
EDITOR’S NOTE: A review of past and projected U.S. expenditures indicates that spending for dental treatment has failed to keep pace with other components of the health care system. Due to the nature of this special report, this article has not undergone peer review.
Numerous analyses from the American Dental Association Health Policy Institute demonstrate the percentage of dentists who indicate they are not busy enough and can see more patients has risen steadily for approximately a decade. According to Vujicic et al,1 “Average real net income of general practitioner dentists in private practice has declined sharply in recent years, reversing a decades-long trend of steady growth.” Waiting times for appointments have decreased and dentists’ earnings are stagnating. In what can be viewed as another sign of economic changes in oral health care, data indicate that dentists who accept Medicaid tend to be busier than those who do not.2 Recent reports from the Centers for Medicare and Medicaid Services and the Agency for Healthcare Research and Quality detail the underlying difficulties, and projections through 2025 signal continuing concerns regarding the future of dental economics.3–5
In recent decades, the U.S. population has grown and undergone dramatic demographic changes. These include increasing numbers of older adult and minority-group residents, as well as the number of individuals with disabilities who have survived into advanced years. At the same time, technological developments have transformed the ability to provide health services in a manner that could not have been imagined by previous generations. The proverbial “bottom line” of these two factors has been a dramatic increase in the proportion of the nation’s gross domestic product allocated for health services, which has risen from 9.1% in 1980 to 13.6% in 2000 and 17.5% (more than $3 trillion) in 2014. In addition, it is projected to reach 20.1% (more than $5.6 trillion) by 2025.3,6,7
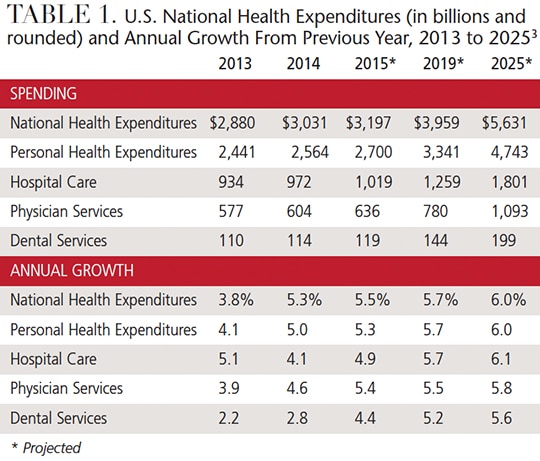
Despite increasing expenditures for dental services — from $13.3 billion in 1980 to $113.5 billion in 2014 (which includes inflation factors) — the annual dental spending growth rate has not kept pace with overall national health expenditures, personal health care, hospital care and other professional services (Table 1).
SHAPING FACTORS
As would be expected, a number of factors — including age, gender and race/ethnicity — affect the use of dental services.
Age: Data from Medical Expenditure Panel Surveys conducted by the federal Agency for Healthcare Research and Quality demonstrate nearly a 6-point increase in the percentage of children less than 5 years of age who incurred dental expenses, but limited change for other age groups (Table 2).4,5
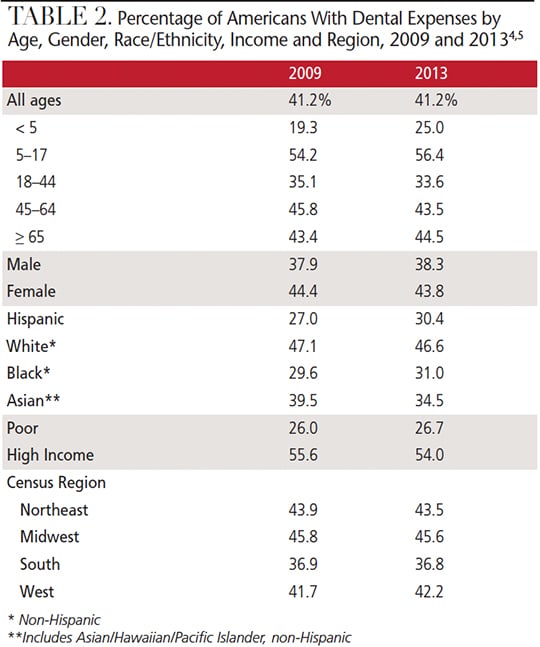
Among the remaining groups, the young adult population (ages 18 to 44 years) incurred the lowest percentage of dental expenses.4,5 According to Barwick,8 “Despite the many advances in dentistry, the millennial generation (those born between 1982 and 2000) has been found to be less interested in dental care. Survey results from the National Health and Nutrition Examination Group reveal that only a little more than 50% of adults age 20 to 34 have been to the dentist in the past year, as compared to 62% of adults between 35 and 64 … the survey found that the millennial group had the highest percentage (85%) of untreated decay, and missing or filled permanent teeth.”
Gender: The data from the Medical Expenditure Panel Surveys also show that fewer males than females had dental expenses.4,5
Race/Ethnicity: Despite some increases, when compared to non-Hispanic whites, a smaller percentage of Hispanics and blacks had dental expenses. As an example of the demographic shifts mentioned at the outset, there has been a dramatic increase in the Hispanic population and its proportional representation in the overall U.S. population. As of 2014, for instance, there were 55.4 million Hispanics, which represents 17.4% of the total U.S. population.9 Among the Asian/Hawaiian/Pacific Islanders, however, there was a decrease in the percentage of this cohort with dental expenses.4,5
ECONOMIC CONSIDERATIONS
Consumer Price Index (CPI): This measure examines the weighted average of prices of a basket of consumer goods and services, such as transportation, food and medical care. The CPI is calculated by taking price changes for each item in the predetermined basket of goods and averaging them; the goods are weighted according to their importance. Changes in CPI are used to assess price changes associated with the cost of living. The CPI for dental services is specific to price changes for this service. For a comparison basis, 1982–84 = 100 is used as the standard figure. The dental CPI for 2009 is 388.1; for 2012, it is 431.7. In Table 3, “current dollars” represent actual costs during a particular period, while “standard dollars” represent the comparative costs based upon the CPI for inflationary factors.10
In terms of current dollars, with the exception of children between ages 5 to 17 years, increases were noted in expenditures for dental services across all age groups, gender, race/ethnicity, economic status and census region (with the exception of the Midwest).4,5
In terms of standard dollars, there were decreases among all groups (except young adults between ages 18 to 44 years, the Asian population and residents of the Western census region). In other words, increases in expenditures for dental services did not keep pace with increases in inflation.4,5
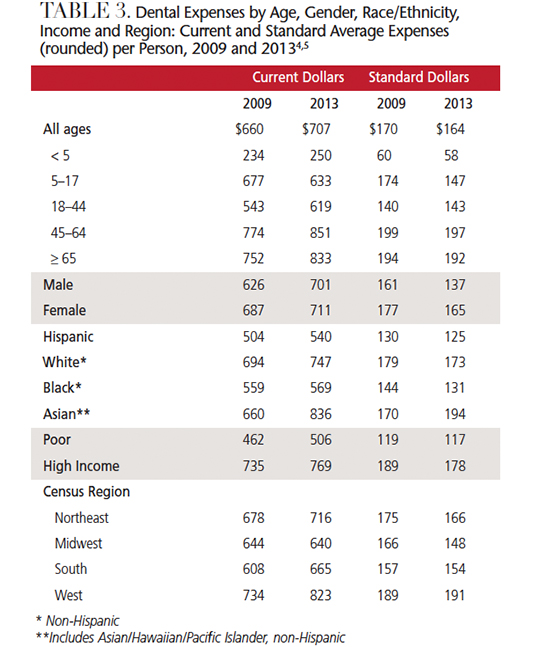
Census Region: The percentage of the population with dental expenses was lowest in the Southern census region (Table 2). Current and standard dollar expenses were highest in the Western census region (Table 3).4,5
Payment Mechanism: Dental expenses are “felt” to a greater extent than costs for other health services; this is because a greater proportion is paid-out-of-pocket for dental than other types of care. Medical Expenditure Panel Survey data show the greatest out-of-pocket proportion was paid by individuals age 65 and older, while young children, blacks and the poor (most of whom were recipients of care under government-sponsored programs, such as Medicaid) paid the least out of pocket.5,11 For example, the proportion of out-of-pocket spending (Table 4) for hospital, physician and dental services in 2013 and projections for 2020 were and will be:
2013 2020
Hospitals 3.5% 2.5%
Physicians 9.5 6.5
Dentists 45.0 35.0
ANTICIPATED TRAJECTORY
Through 2025, the anticipated trajectory of the proportional growth in expenditures for dental services is less than projections for national overall health expenditures, personal health care, hospital care and other professional services.3
A recent paper by Waldman and Perlman12 emphasized that “general population demographics in the United States are undergoing dramatic changes. Long-term customary populations that provided the bulwark for many successful dental practices are being replaced by the many minority populations, in particular, the Hispanic population. Decades of studies and reports based on race/ethnicity, income, residency locations and insurance have emphasized the disparities in the delivery of dental care to the general public.”

In the context of these general population developments, the demographic profile of the dental profession is experiencing change, albeit in more limited fashion. Based on recent trends, women now represent nearly 50% of the dental student population.13 When compared to the general population, Asian students have been overrepresented among dental school graduates over the past decade, while other minorities continue to be underrepresented.12
In addition, Brault14 notes, “No review of population changes would be complete without reference to individuals with disabilities.” Brault reports that in 2010, approximately 56.7 million people, or 18.7% of the U.S. population, had some kind of disability. About 12.6% (or 38.3 million) had a severe disability. The overall number of these individuals has increased — and will continue do so. As an additional consideration in terms of dental services, in 2010, almost 29% of Americans with disabilities (many of whom are dependent upon Medicaid) did not seek dental care due to cost.15
CONCLUSION
This review of past and projected U.S. health expenditures indicates that spending for dental treatment has failed to keep pace with other components of the health care system. Additionally, the future economics of the dental profession are linked to patient demographic changes and care-delivery models that place increased emphasis on group practice. In order to evolve in an economically viable fashion, the dental profession needs to more closely mirror the diversity of the U.S. general population, expand delivery of services to all patient groups, and find ways to provide — and fund — more effective preventive care.
Ultimately, the key to controlling rising expenditures for health services is to emphasize interdisciplinary care among dental and medical providers, with the goal of improving oral/systemic health and reducing the overall cost of care.
KEY TAKEAWAYS
- Despite increasing expenditures for dental services, the annual dental spending growth rate has not kept pace with overall national health expenditures.
- Various analyses demonstrate the percentage of dentists who say they are not busy enough has risen steadily for approximately a decade.
- Reports indicate that dentists who accept Medicaid tend to be busier than those who do not.2
- Dental expenses are “felt” to a greater extent than costs for other health services; this is because a greater proportion is paid-out-of-pocket for dental than other types of care.
- The future economics of the dental profession are linked, in part, to patient demographic changes and care-delivery models that place increased emphasis on group practice.
- In order to evolve economically, the dental profession needs to more closely mirror the diversity of the U.S. general population, expand delivery of services to all patient groups, and find ways to provide — and fund — more effective preventive care.
References
- Vujicic M, Wall TP, Nasseh K, Munson B. Dentists Income Levels Slow to Recover. Health Policy Institute Research Brief. Available at: ada.org/~/media/ADA/Science%20and%20Research/HPI/Files/HPIBrief_0213_1.pdf?la=en. Accessed June 21, 2017.
- Vujicic M. Solving dentistry’s ‘busyness’ problem. J Am Dent Assoc. 2015;146:641–643.
- Keehan SP, Poisal JA, Cuckler GA, et al. National health expenditure projections, 2015–25: Economy, prices, and aging expected to shape spending and enrollment. Health Aff (Millwood). 2016;35:1522–1531.
- Agency for Healthcare Research and Quality. Medical Expenditure Panel Survey: 2009. Available at: meps.ahrq.gov/mepsweb/data_stats/quick_tables_results.jsp?component=1&subcomponent=0&year=-1&tableSeries=1&tableSubSeries=&searchText=&searchMethod=3&startAt=101&sortBy=. Accessed June 21, 2017.
- Agency for Healthcare Research and Quality. Medical Expenditure Panel Survey: 2013. Available at: meps.ahrq.gov/mepsweb/data_stats/quick_tables_results.jsp?omponent=1&subcomponent=0&tableSeries=1&year=-1&SearchMethod=1&Action=Search. Accessed June 21, 2017.
- National Center for Health Statistics. Health, United States, 2015. Available at: cdc.gov/nchs/hus/healthexpenditures.htm. Accessed June 21, 2017.
- National Center for Health Statistics. Health, United States, 2014. Available at: cdc.gov/nchs/data/hus/hus14.pdf, Accessed June 21, 2017.
- Barwick K. Dental Care for the Millennial Generation. Available at: karenbarwickdds.com/dental-care-for-the-millennial-generation./. Accessed June 21, 2017.
- Krogstad JM, Lopez MH. Hispanic population reaches record 55 million, but growth has cooled, June 25, 2015. Available at: pewresearch.org/fact-tank/2015/06/25/u-s-hispanic-population-growth-surge-cools. Accessed June 21, 2017.
- Consumer price index. Available at: investopedia.com/terms/c/consumerpriceindex.asp. Accessed June 21, 2017.
- U.S. Centers for Medicare and Medicaid Services. National Health Expenditures Projections 2011–2022. Available at: cms.gov/Research-Statistics-Data-and-Systems/Statistics-Trends-and-Reports/NationalHealthExpendData/Downloads/Proj2012.pdf. Accessed June 21, 2017.
- Waldman HB, Perlman SP. Dental practice as the population demographics change in Massachusetts. J Mass Dent Soc. 2016;64:22–25.
- American Dental Education Association. U.S. Dental School Applicants and Enrollees. Available at: adea.org/data/Dental-School-First-Time-Enrollees-by-Gender-2000-to-2016.pptx. Accessed June 21, 2017.
- Brault MW. Americans With Disabilities: 2010. Current Population Reports. Available at: census.gov/content/dam/Census/library/publications/2012/demo/p70-131.pdf. Accessed June 21, 2017.
- National Center for Health Statistics. Health, United States, 2011: With Special Feature on Socioeconomic Status and Health. Available at: cdc.gov/nchs/data/ hus/hus11.pdf. Accessed June 21, 2017.
The authors have no commercial conflicts of interest to disclose.
FEATURED IMAGE BY DRAGONIMAGES/ISTOCK/GETTY IMAGES PLUS
From Decisions in Dentistry. July 2017;3(7):18,21—23.

[…] The Harsh Realities in Dental Economics […]
[…] The Harsh Realities in Dental Economics […]