

SPECIAL REPORT: Improving Care for Patients With Special Needs
Now is the time to ramp up efforts to increase access to care for this patient population.
Now is the time to ramp up efforts to increase access to care for this patient population
EDITOR’S NOTE: In light of federal projections for an increase in the number of Americans with special needs, oral health professionals should prepare now to ensure appropriate care for these patients. Due to the nature of this special report, this article has not undergone peer review.
One of the realities facing oral health professionals is that economic trends and population-based changes affecting U.S. dental practices indicate a continuing downturn in practice busyness and stagnation of expenditures for dental services. The long-term customary populations that provided the bulwark for many successful dental practices are being replaced by minority populations, particularly Hispanics. Decades of studies based on race/ethnicity, income, residency locations and insurance have emphasized the disparity in the delivery of dental care to the general public.1
In addition, despite modifications in dental school programs to better prepare the new generation of practitioners, and the need to broaden the potential patient population base and reverse the downturn in practice busyness, dental services too often remain limited for significant numbers of individuals with special needs.1 For example, nearly 29% of individuals with disabilities (many of whom depend upon Medicaid for care) do not obtain dental services due to cost.2 In addition, newspaper accounts report that Medicaid dentists are “hard to find.”3
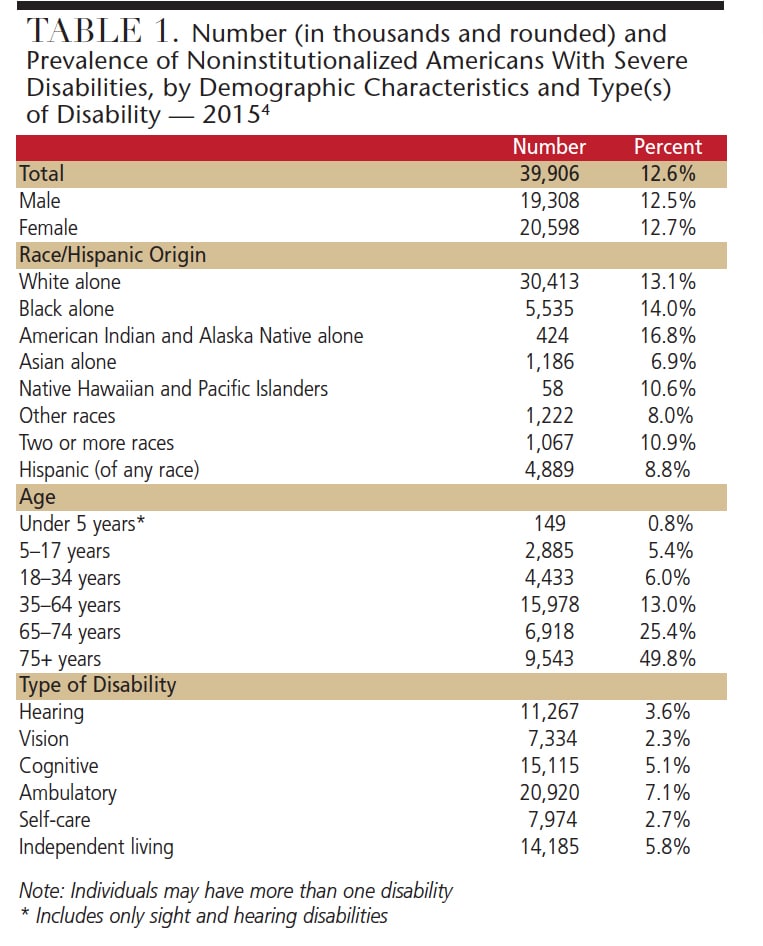
Unfortunately, the use of all-inclusive mega numbers and proportions makes it difficult for the average individual to place this in proper perspective. For example, during the present decade, approximately 56.7 million Americans (almost one in five) have some form of disability (including 39.9 million individuals with severe disabilities).4 According to federal projections, by 2030 there will be approximately 45.8 million Americans with severe disabilities (Table 1 and Table 2). As a result, these estimates become “just numbers” — rather than actual people. If dental providers are to increase the profession’s — as well as policymakers’ and other health care and social professions’ — attention to the health and social needs of patients with disabilities, the challenge is to personalize these numbers.
If, in fact, “all politics is local,” as Tip O’Neil, former speaker of the House of Representatives, frequently intoned, the stream of mega numbers must be presented in a manner that can be easily understood. Thus, instead of discussing the incomprehensible number of Americans with disabilities and needed services that range in the hundreds of billions of dollars, it’s important to lobby the health professions and policymakers by providing specific information about their communities and constituencies.
DISTRIBUTION OF INDIVIDUALS WITH DISABILITIES
There are many differences in the proportion and numbers of Americans with disabilities when considered by gender, race/ethnicity, age and types of disabilities. There is a greater proportion of individuals with disabilities among:
- Females than males (to a degree reflecting the greater numbers of women in senior years)
- American Indians and Alaska Natives, blacks and whites than Hispanics and Asians
- Older than younger populations
- Among individuals with ambulatory and cognitive disabilities than other disabilities (Table 1)
The U.S. Census Bureau’s American Community Survey provides detailed numbers and proportion of individuals with various types of severe disabilities by national, state, county, congressional district, school district and urban areas. Information by gender, race/ethnicity, age and types of disability are also available for each of these geographic distributions.4 The data for the national, state and congressional district levels were used in this review to delineate current and future numerical and proportional rates of individuals with disabilities.
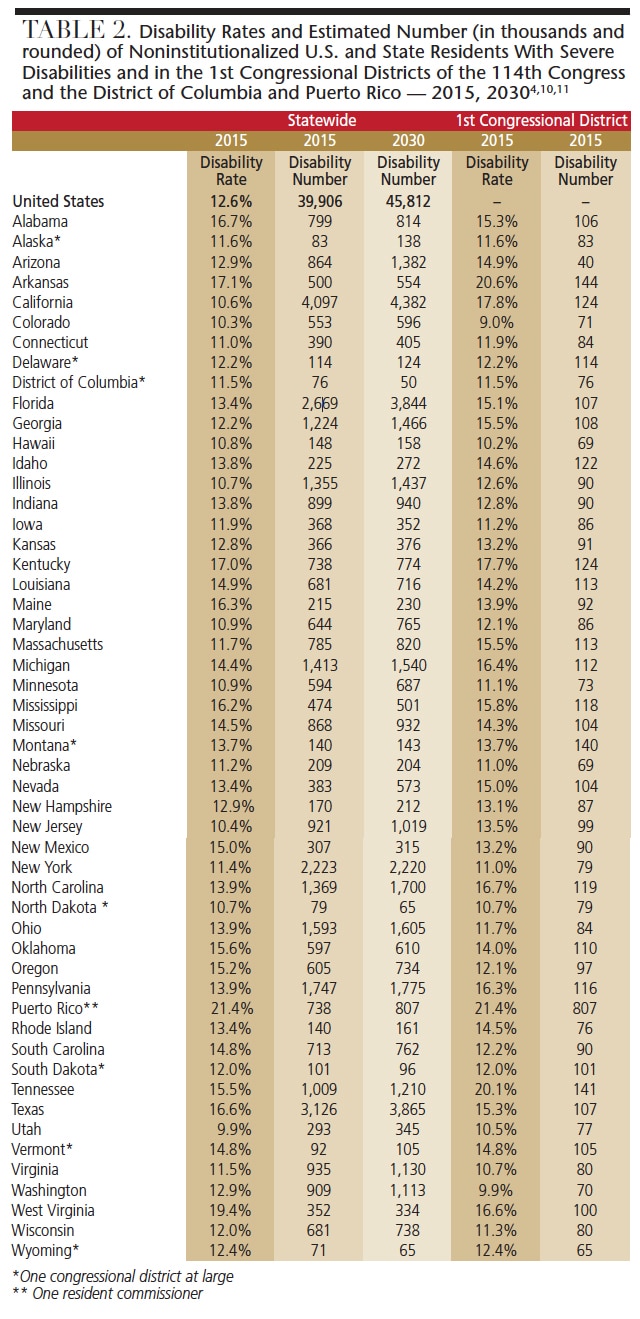
Method: The projected estimated proportion and number of individuals with severe disabilities are not available for the 2030 year. They were developed using Census Bureau general total population projections for 2030, and 2015 proportional rates for individuals with disabilities to provide an appreciation of the realities that a numeric increase in the total general population (particularly the older-age population) can — and will — increase the number of individuals with disabilities.
The 1st Congressional District in each state was selected as a simplified example for political lobbying purposes. (Note: Seven states, the District of Columbia and Puerto Rico have one congressional district-at-large or one resident commissioner.) Thus, this information for the single congressional district states will constitute the same report for the entire state. The data for the 43 1st Congressional Districts and seven at-large congressional districts are not necessarily representative of the disability proportions or numbers in the 385 congressional districts not included in this review. It does, however, provide a model that may be used to present, in a meaningful manner, the number of constituents with disabilities (and their families) in the district of each member of the House of Representatives.
DISTRIBUTION OF INDIVIDUALS WITH DISABILITIES BY STATE
As seen in Table 2, in 2015, the proportion of individuals with severe disabilities ranged from 9.9% in Utah and 10.3% in Colorado, to 19.4% in West Virginia and 21.4% in Puerto Rico.
The estimated number of individuals with severe disabilities ranged from 71,000 in Wyoming and 76,000 in the District of Columbia, to 3.1 million in Texas and 4.1 million in California.
Based on the total number of state residents and proportion with disabilities in 2015, by 2030 the estimated number of residents with severe disabilities will range from 50,000 in the District of Columbia to 65,000 in North Dakota and Wyoming, to 3.9 million in Texas and 4.4 million in California.
DISTRIBUTION OF INDIVIDUALS WITH DISABILITIES IN 1st CONGRESSIONAL DISTRICTS
In 2015, the estimated proportion of residents with severe disabilities in the 1st Congressional Districts ranged from 9.0% in Colorado and 9.9% in Washington, to 20.1% in Tennessee and 20.6% in Arkansas (Table 2). The estimated number of individuals with severe disabilities ranged from 40,000 in Arizona to 65,000 in Wyoming, to 141,000 in Tennessee and 144,000 in Arkansas.
The challenge, as noted by one practitioner quoted in a paper by Waldman et al,5 is that “I am one of only two dentists in Oklahoma who devotes a major portion of my practice to caring for patients with special health care needs. The other dentist is in Tulsa (90 miles away). Patients travel from all over the state to come to my office; many having traveled three hours or more one way. Some have to stay the night in a hotel because it is too taxing to travel that far in one day. Many of my referrals come from pediatric dentists who do not feel qualified to provide general dental services to adult patients who often require endodontic procedures, periodontal treatment or surgical extractions.”
THE FACT REMAINS THAT ONE IN FIVE AMERICANS IS AFFECTED BY DISABILITIES, AND MANY ARE IN NEED OF ORAL HEALTH CARE
General dentists provide the majority of oral health services for children and continue the needed care as youngsters mature into their adult years. By contrast, pediatric dental specialists are technically limited to the patient’s early years if they are to maintain status as board certified pediatric dentists. As noted by Waldman et al,6 it is quite difficult to secure needed oral health care for adults with special health care needs, because of (1) limited current practitioner educational opportunities, and (2) limited financial support (e.g., Medicaid programs in most states provide little to no coverage for adult dental services). As a result, young adults may need to seek or continue to receive care from pediatric dental specialists; however, pediatric dental practice is officially limited to serving children.
Recommendation: Until such time that general and specialty dental professionals are adequately prepared to provide services for individuals with moderate or severe disabilities, the authors propose that pediatric dentistry as an age-defined specialty (and the specialty specifically prepared to care for patients with special needs) adopt a more flexible and realistic approach to oral health care for adults with special health care needs.
It was not until 2004, that the U.S. Commission on Dental Accreditation (CODA) adopted a new standard (with implementation in 2006) stating that “graduates must be competent in assessing the treatment needs of patients with special needs.”7 The standard does not require clinical experience during dental school training, however. Subsequent to the establishment of the new standard, a study of the clinical experience in the care of individuals with special needs indicated that some schools had supplemented their curricula to include clinical experiences in the care of these patients.8
ADDITIONAL BARRIERS TO CARE
In addition, there are barriers in preparing current practitioners to provide care to individuals with special needs — specifically, dentists who graduated from dental school prior to implementation of the CODA standard in 2006 (or later, depending upon the CODA review schedule of individual schools). For instance, an increasing number of state dental boards stipulate mandatory continuing education hours as a condition for relicensure. However, they do not specify courses for the care of individuals with special needs. The fact is that a review of continuing education programs in the larger dental conventions identified few, if any, courses for the care of individuals with special needs. As just two examples:
- Attaining mastership in the Academy of General Dentistry — a professional designation within the academy that reflects a general dentist’s ongoing commitment to provide quality care through continuing education — requires a specified minimum number of hours in a range of subjects, including special patient care. Unfortunately, only a limited number of course presentations are available to meet these requirements.5
- The Massachusetts Dental Society Yankee Institute listing of license renewal-approved continuing education courses between March and October 2016 contains about 40 programs, including infection control, eating disorders, oral cancer, radiology, ethics and sleep apnea management — but has only a single listing for “Success and Preparation for Patients With Special Needs.”9
Nevertheless, the fact remains that one in five Americans is affected by disabilities, and many are in need of oral health care. Surely, it is reasonable to increase access to care for this and other populations — an endeavor that will simultaneously increase dental practice busyness.
Recommendation: The authors suggest that individual practitioners and dental groups approach legislators and policymakers with facts concerning the oral health requirements of individuals with special needs. Recognizing that lobbying is a competitive process directed at legislators who are balancing the demands of organized groups, political parties and complex economic realities, any effort that can personalize the needs of individuals with disabilities (and their families) will have the greatest chance to have a positive impact.
SUMMARY
When oral health professionals speak of ethics, most often it’s in connection with an individual practitioner’s behavior. Ethics, however, also reflects a group’s actions or moral performance in a range of evolving circumstances. As a profession, dentistry is defined as an occupation that requires a specialized course of higher education and a career of continuing education. It is also governed by a special code of ethics. What higher calling is there than working together to meet the health care needs of children and adults with disabilities?
References
- Waldman HB, Perlman SP. Access to dental care depends on appreciation of demographics and economics. J Am Coll Dent. 2016;83:41–47.
- National Center for Health Statistics. Health, United States, 2011: With Special Feature on Socioeconomic Status and Health. Available at: cdc.gov/nchs/data/hus/hus11.pdf. Accessed March 17, 2017.
- Otto M. For want of a dentist. Washington Post. Available at: washingtonpost.com/wp-dyn/content/article/2007/02/27/AR2007022702116.html. Accessed March 17, 2017.
- U. S. Census Bureau. 2015 American Community Survey 1 year estimates. Available at: factfinder.census.gov. Accessed March 17, 2017.
- Waldman HB, Ackerman MB, Perlman SP. Increasing use of dental services by children, but many are unable to secure needed care. J Clin Pediatr Dent. 2014;39:9–11.
- Waldman HB, Rader R, Sulkes S, Perlman SP. Pediatric dentistry as part of a long continuum of care: a commentary. J Clin Pediatr Dent. 2016;40:259–262.
- Commission on Dental Accreditation. Accreditation Standards for Dental Education. Chicago, Il: American Dental Association; 2012.
- Clemetson, JC, Jones DL, Lacy ES, Hale D, Bolin KA. Preparing dental students to treat patients with special needs: changes in predoctoral education after the revised accreditation standard. J Dent Educ. 2012;76:1457–1465.
- Massachusetts Dental Society Yankee Institute. 2016 Continuing education. Available at: massdental.org/~/media/Files/Yankee-Institute-CE-Brochure-2016.ashx?la=en. Accessed March 17, 2017.
- Population of the World. Projections of population growth of Puerto Rico (2030). Available at: livepopulation.com/population-projections/puerto-rico-2030.html. Accessed March 17, 2017.
- U.S. Census Bureau. Interim projections of the total population for the United States and States: April 1, 2000 to July 1, 2030. Available at: census.gov/population/projections/files/stateproj/SummaryTabA1.pdf. Accessed March 17, 2017.
The authors have no commercial conflicts of interest to disclose.
Featured photo by Squaredpixels / istock / Getty Images Plus
From Decisions in Dentistry. April 2017;3(4):12–15.
