
Trends in Dental Participation in Medicaid and CHIP
What influences dentists to participate in Medicaid or the Children’s Health Insurance Program (CHIP)?
What influences dentists to participate in Medicaid or the Children’s Health Insurance Program (CHIP)? One might assume determining factors would include reimbursement rates, the extent of services covered, local competition trends, and the number of low-income patients in the community. Certainly, all may have a bearing — but, as data from the American Dental Association Health Policy Institute show,1 it is not easy to draw correlations between participating in Medicaid and CHIP and any single factor.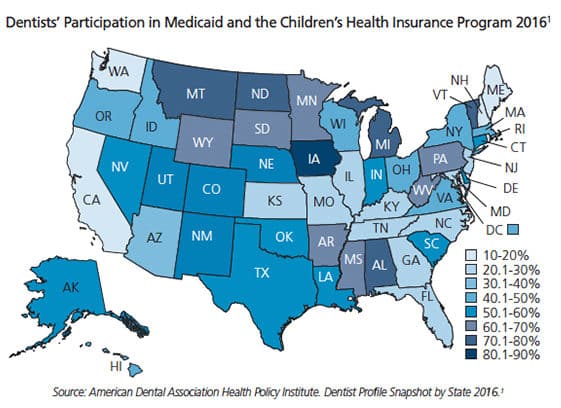
Take non-Medicaid expansion states for example.2 Some, such as Alabama, South Dakota and Wyoming, have dentist Medicaid and CHIP participation rates far above the national average of 38.6%. Others, such as Kansas and Missouri, are far below the national average.1
Poverty also does not easily correlate. Among the 10 poorest states in the nation3 are both high-participating states (e.g., Alabama at 74.2%) and low-participating states (e.g., Arizona at 27.8%).1
 Reimbursement correlates somewhat, but not nearly to the extent it does for physicians.4 For example, Iowa has the highest dentist participation rate in the country at 85.5%,1 but its Medicaid reimbursement rate is only 40.4% of the usual fees and 49.1% of private insurance reimbursement.4 The scenario is nearly the same in North Carolina (43.7% and 52.9%, respectively),4 where the participation rate is 29.7%1 — nearly 10% below the national average.
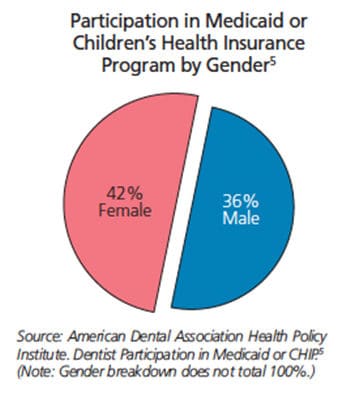
Gender and age also appear to be factors, as female dentists and younger clinicians are more likely to participate in Medicaid or CHIP than their peers.5
Dentist shortages areas also correlate somewhat, as states with the highest number of people living in shortage areas, such as Florida and Washington,6 are below the national average in Medicaid and CHIP participation. However, Pennsylvania and Ohio both have around 2.1 million people living in dentist shortage areas, yet Pennsylvania has a much higher participation rate than Ohio — and, for that matter, New York, where 2.7 million live in provider shortage areas.1,6
The reasons dentists participate in these programs are complicated and, presumably, affected by localized factors, including the specific payer-makeup of patients, trends in local competition, reimbursement rates, and even the practice philosophy and life stage of the provider.
REFERENCES
- American Dental Association Health Policy Institute. Dentist Profile Snapshot by State 2016. Available at: https://www.ada.org/en/science-research/health-policy-institute/data-center/supply-and-profile-of-dentists. Accessed December 17, 2018.
- Families USA. A 50-state look at Medicaid Expansion. Available at: https://familiesusa.org/product/50-state-look-medicaid-expansion. Accessed December 17, 2018.
- U.S Census Bureau. Income and Poverty in the United States: 2017. Available at: https://www.census.gov/library/publications/2018/demo/p60-263.html. Accessed December 17, 2018.
- American Dental Association Health Policy Institute. Medicaid Participation and Reimbursement for Physicians and Dentists in Every State. Available at: https://www.ada.org/en/science-research/health-policy-institute/publications/webinars/medicaid-participation-and-reimbursement-for-physicians-and-dentists. Accessed December 17, 2018.
- American Dental Association Health Policy Institute. Dentist Participation in Medicaid or CHIP. Available at: https://www.ada.org/~/media/ADA/Science%20and%20Research/HPI/Files/HPIGraphic_0217_1.pdf. Accessed December 17, 2018.
- U.S. Department of Health and Human Services. Designated Health Professional Shortage Areas Statistics. Available at: https://ersrs.hrsa.gov/ReportServer?/HGDW_Reports/BCD_HPSA/BCD_HPSA_SCR50_Qtr_Smry_HTML&rc:Toolbar=false. Accessed December 17, 2018.
From Decisions in Dentistry. January 2019;5(1):46.

Informative article.